Showing posts with label statistics. Show all posts

23 November 2024

No, Rwanda didn't "fiddle" its poverty stats

A couple of weeks ago, France24 ran a story featuring accusations by Belgian Professor Filip Reyntjens that the Government of Rwanda had manipulated its poverty statistics. The truth, to my relief*, is somewhat less exciting.

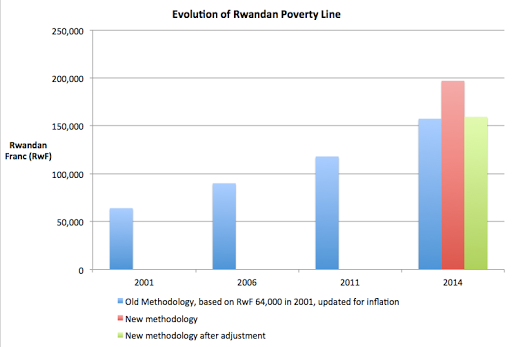
What seems to have actually happened, is that Rwanda quite resonably decided to update the methodology for calculating what the poverty line should be, but then found that the new methodology led to an implausibly high poverty line, and so decided to (slightly arbitrarily) “adjust” the new methodology, resulting in the final poverty line being almost exactly what you would have expected it to be had you simply updated the original poverty line for inflation.

It took me a while to figure all this out, as the original criticism and rebuttal by NISR weren’t entirely clear, and it was only in Filip’s reaction to NISR’s rebuttal that I grasped his (mistaken) point (here’s also the Rwanda EICV4 Report and EICV3 Report).

How is poverty measured?

Rwanda has followed a fairly typical process - set a poverty line by first defining a minimum quantity of calories needed, second working out how much it would cost a poor person to buy that many calories, third increasing that amount by 40% to account for some basic minimum non-food spending needs. Then to get your poverty rate, just calculate how many people spend less than the poverty line.

What was the disagreement about?

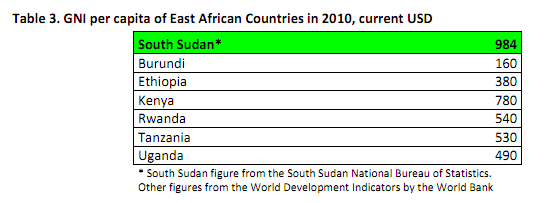
Rwanda’s poverty line was set in 2001 based on how much it cost then to purchase a basket of goods that poor people bought back then. You need to keep your methodology consistent over time to allow for fair comparisons, but its also reasonable to think that the minimum consumption basket is likely to change over 15 years of rapid growth.

The government of Rwanda decided to keep the minimum assumed number of calories (2,500 per day, which is pretty high), but change step 2 - the way of working out how much it costs to buy these calories. In a normal survey year, this cost is simply updated for inflation (even if prices and consumption habits have changed in the meantime). This year, Rwanda decided to make an update to the prices and consumption habits, but found something odd. Most poor people consume far fewer than the minimum number of calories - almost half. So how do you construct a hypothetical “ bare minimum" food consumption basket, that is twice as big as what people actually buy? Do you just double everything? Or do you assume that if people bought more food than they did, they might buy more of some items than others? This is where the big disagreement presumably came. Rather than choosing to simply double everything, the Rwandan stats agency made a few arguably arbitrary choices about which items to increase and which to decrease, that has a big effect on the overall price of the basket, and therefore the overall poverty line, and therefore the poverty rate.

Why is Filip Reyntjens wrong?

Filip argues, correctly, that Rwanda’s assumptions about how to scale up consumption patterns to reach their minimum calorie basket, affects the overall line. In fact, their adjustments reduce the line by 19%. But his next step is wrong. He argues that as this new methodology line has been reduced by 19%, we should also reduce the 2010/11 line by 19%, giving a substantially lower poverty rate in 2010/11, and therefore an increase in 2013/14. But he misses the intermediate step - the Rwandans didn’t just adjust the new food basket, they first also calculated a whole new food basket.

Yes, what should really happen is for the new methodology to applied retrospectively to all the old survey data to allow for truly comparable numbers, but the adjustment made to the new methodology leads you to a poverty line that is basically the same as it would have been with the old methodology anyway.

Implications for how we measure poverty?

One thing that this choice really highlights is the number of assumptions you sometimes need to make, and the fragility of the whole concept of poverty estimates.

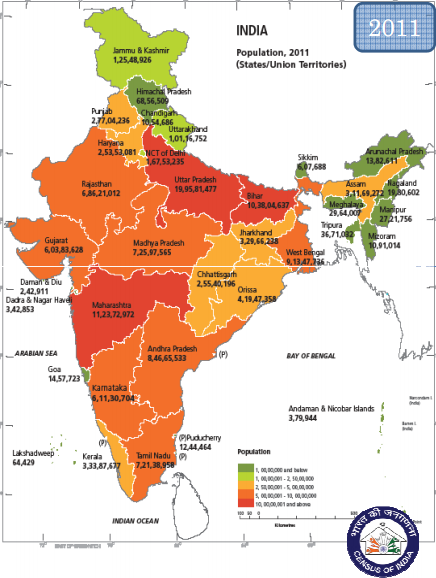
Here's an example of another seemingly arbitrary choice of assumption with big consequences - the Indian stats agency used to measure poverty with surveys that asked people how much food they had bought in the last 30 days, longer than practice elsewhere which uses 7 day recall periods. To their great credit the stats agency decided to run a randomised control trial to test these two methods against each other. The result was that moving from a 30 day to a 7 day recall period increased measured consumption massively - and reducing poverty by 175 million people - close to half of all those in poverty (from Angus Deaton’s 2014 LSE lecture, via Nic Spaull).

The bottom line: measurement is hard, and it is possible for reasonable people to disagree, without there necessarily being any nefarious trickery.

---

* Relief, because I have previously worked both for OPM as a staff member, on a project with OPM for the Rwandan Stats agency, and directly on a project for the Rwandan Ministry of Finance.

13 December 2024

Statistical literacy at DFID

Some fascinating results from a new survey of DFID staff about their use and knowledge about evidence (credit to DFID for doing this and for publishing it), including these delicious stats:

84% seem to know what an RCT is
77% know what a census is, aaaaaaand
39% know what a national sample survey is.

hmmmmmmmmm........... maybe there is a point somewhere after all in all of this scepticism about the RCT hype ........?

25 November 2024

London bicycle stats

# cyclists killed in London in the past 2 weeks: 6
# police deployed to street corners in response, to patronise cyclists and warn them about cycling sensibly, wearing helmets, and listening to music: 2,500
% cyclists killed in London whilst breaking the law: 6%
% cyclists killed in London by a HGV turning left right into them: 50%
Average annual cycle deaths in Amsterdam (where most people don't wear helmets): 6
Average annual cycle deaths in Paris: 2

21 May 2025

Seeing like a State vs Seeing like a Donor

In which Justin Sandefur takes Chris Blattman and Bill Gates to school.... he argues that African governments don't need GDP data or internationally comparable micro survey data, they need good quality administrative data.
This, rather than the need for more duplicative household surveys, is the big challenge facing African statistics. Right now governments face a trade-off between high quality survey data of limited relevance, and low quality administrative data that actually fits their needs. It doesn’t have to be this way. But to overcome the trade-offs donors are going to have to back off with their pet survey projects, and stats bureaus across Africa will need to exert some renewed independence, and stop serving as research consultancies for donors.
Zing!

21 May 2025

The Lancet's editors don't get evaluation (sadface)

So Matt beat me to the punch on Friday on the Lancet Millennium Village retraction. Since then I've being trying to think of a polite way of expressing my total dismay and despair at the tripe written by the Lancet editors in response to the retraction (for which, by the way, a little bit of Kudos to Pronyk et al).

The Lancet editors write:
The Millennium Villages project team has quickly and commendably corrected the record after understanding the validity of the challenge it received. But the withdrawal of this element of the paper does not detract from the larger result—namely, that after 3 years Millennium Villages saw falls in poverty, food insecurity, stunting, and malaria parasitaemia, together with increases in access to safe water and sanitation.
Which is just total nonsense. For all we know, poverty fell in the Villages at the exact same rate as everywhere else. That is not an important result to be celebrated. I challenged Lancet editor Richard Horton on twitter as to why he would continue to emphasise this non-result, and he responded with yet more nonsense;

  1. richardhorton1 @rovingbandit To be fair, there were falls in each of the 5 MDG-1 poverty/nutrition measures, but these were not statistically significant. from web

That isn't even true. The first of the measures - wealth - is the opposite of poverty. It is *wealth* that fell (statistically insignificantly) in the Villages relative to comparisons. I despair. And kind of question my own sanity. Despite what Tim Worstall says, I'm really not a scientist, but its pretty galling that people say economics is not a science like the physical sciences when this is the kind of guff published by the world's top medical journal.

Bill Easterly has a whole long list here of more terrible social science published in medical journals. At the bottom of the post, Ben Goldacre comments
i think journals publishing things outside of their field of expertise is risky, but i wld caution against developing a world view that economics journals are in a better shape overall than medical ones. as someone who flits into both, there are lots of things that are routine in medical journals, to a greater or lesser extent, but notably almost unheard of in economics. stuff like declarations of conflict of interest, structured write-ups, registering a protocol in advance of doing a study, etc. all of which wld be great to see more of outside medicine.
All of which is true. In particular I am struck by how easily readable a short, structured, 4 page Lancet write-up is. There are definitely lessons to be learnt across disciplines both ways. It's just an incredibly sad state of affairs that one of the lessons that journals of medicine, the discipline that gave us randomized controlled trials, needs to learn from economics, is a more careful attention to statistics and causality. 

15 May 2025

Think Hemingway

Andrés Marroquín and Julio H. Cole ran a statistical analysis of the length of words used in Nobel Laureate speeches. Winners for Literature use shorter words than in other disciplines. And as a general rule of thumb I would guess that Nobel prize winners in literature are also better writers. Ergo, use short words dummy. The statistical evidence says so.

15 April 2025

Questionable South Sudan Poverty Statistics

Yes, it seems that today I will mostly be procrastinating in avoidance of finishing my report by reading the House of Commons report. Thanks for that Tom.

Here's a quote from the backgrounder section: 
Eight out of ten people live on an equivalent of less than one $1 (63p) per day.
Now maybe this is nitpicking, but the best data we have says that the poverty rate in South Sudan is 50% (against a national poverty line). You can't just throw out an 80% figure without saying why you chose to look at $1 a day, whether you are talking PPP or not, or providing a source.

13 April 2025

Herbert Gintis reviews Taleb's "The Black Swan"

I was shocked that OJ Simpson was acquitted of a murder he obvious committed. I am shocked that most Americans do not believe in evolution. And I am dumbfounded at the widespread success of this really stupid piece of pseudo-literature ... 
It would be lovely to have a sensitive exposition of great unexpected events, such as the fall of the Soviet Union, Black Monday, and the shooting of Robert Kennedy. This woeful volume is not it. I can't image what anyone finds valuable in The Black Swan. This too is a completely unforseen event, but is also difficult to explain in hindsight.
Ouch.

16 February 2025

Why has poverty fallen in Rwanda?

Following the presentation of the headline 12% point reduction in poverty over the last 5 years in Rwanda, the full reports are now available from the National Institute of Statistics (here and here).
One contributory factor will be the reduction in average household size over the period (implying reduced consumption needs); this is consistent with the declining fertility rate reported in the DHS surveys. 
Based on the income data, the survey results show an important increase in the contribution of wage income and also an increase in income from transfers; the share of agricultural income falls modestly though remains the majority source of income.  
Analysis of the survey data confirms the importance of wage activity by identifying that there has been substantial creation of jobs, predominantly in non-farm activities, over the past five years. Which areas these jobs are in, still needs to be investigated in subsequent work.  
A second factor identified from the survey data is increased agricultural production. Looking at aggregate production data confirms significantly higher production levels in 2010/11 than 2005/06, most strikingly in the Northern Province followed by the Western Province (the key producing regions), and this is despite the fact that average land size cultivated per household has fallen over the period. This pattern of increased production is consistent with production data from MINAGRI. At the same time, there was a substantial increase in the use of chemical fertilisers in agriculture over this period. 
A third factor has been increased commercialisation of agriculture. In 2005/06, households sold around 18% of their output on average but by 2010/11 the average proportion of output sold had risen to 25%. There was increased demand for agricultural production from Rwanda over this period from neighbouring countries and in part in response to food crises elsewhere. A fourth factor is the increasing importance of transfers over the period, both private and public. While these do not just benefit the poor, they have contributed to poverty reduction over the period.

18 August 2025

New Official GDP Figures for South Sudan

Available at the all-new website of the South Sudan National Bureau of Statistics

Of note is that Gross National Income is higher in South Sudan than all of its East African neighbours. 


(Thanks LT for the notice). 

22 June 2025

Why there are ODI Fellows

"Sh251 billion [~USD 2.5 billion] mathematical error in the 2011-2012 Kenyan Budget pointed out by Mars Group."
Daily Nation.

Kudos to the Mars Group for actually reading the budget.

I should add that its not just developing countries that need economists/numerate people. I once had to review a report prepared by a British civil society organisation whose careful analysis revealed that as many as half(!) of the British population earn less than median income.

31 March 2025

India is really really big

I just got this email from the Skeptical Bandit (republished with permission). Just to clarify - this is not my alter ego but a real person with poor taste in pseudonyms.
India released its prelim Census estimates today. Lots of blog worthy nuggets -
India's population is about the size of the US, Brazil, Pakistan, Bangladesh, Indonesia and Japan put together. 
Its more than the whole of Africa and just UP (my beloved home state) has a greater population than any developing country but China or Indonesia- so much for all the people who say India is over-studied in development or over-invested in aid!!! 
The cost of doing a Census is about 40 cents per person. This is somewhere between one-thirtieth and one-fiftieth of the cost in South Sudan. Not saying that the differences in cost of service delivery are always the same magnitude, but guess why it REALLY makes sense to be looking at India. 
Lots of changes in demographics - an improving sex ratio, decreasing growth (esp in the most populous states) and a pretty significant jump in literacy with greater gains for women.
I've attached their PDF presentation here. Take a look. very nifty!


A note on this map - non-Indians should read the numbers with care - the commas are in unusual places due to Crores or Lakhs or some weird thing like that.

New data on States in Southern Sudan

The SSCCSE has uploaded the latest version of the Key Indicators document on its website. 
Key Indicators are now also available for each of the individual states. 
The link is http://ssccse.org/key-indicators-for-southern-su/
We hope you find these documents useful and please let us know if there are any comments or feedback.

22 December 2024

Key Indicators for Southern Sudan

Dear journalists,

Next time you need some Southern Sudan stats, try here first.

thanks,

Lee

02 December 2024

The Economist still using made-up poverty stats


That 90% living on less than $1 a day stat? Pulled completely out of thin air about 5 years ago because there was no data. Literally just made up on the spot.
Now there is some data, thanks to the hard work of the staff at the Southern Sudan Centre for Census, Statistics and Evaluation, and some generous funding and technical assistance from various donors. And it is even ONLINE. image
I used to think that statistics in poor countries were underfunded, but if we’re all going to ignore them anyway and just make stuff up….

UPDATE: Oh yeah, and I forgot to mention, this one fully conforms to Easterly's "First Law of Development Stats: Whatever our Bizarre Methodology, We make Africa look Worse".

The actual real stats (not yet adjusted for PPP) would put the proportion of the population living on less than $1 a day at more like 50%.

04 August 2025

MPI

Yet more on the multi-dimensional poverty index (bored yet?):

1. The Economist is a fan (“the MPI is a step forward”)

image

2. Gabriel Demombynes at the World Bank answers Stefan Dercon’s question (what are you for, MPI?). The MPI is a marketing tool.

The general effect of launching a composite measure, such as the Corruption Perception Index or the Commitment to Development Index, is to focus attention on the subject matter. We’ll probably hear more people talking about multidimensional poverty in the next few months as a consequence of the MPI.

That is certainly true. Nice seeing you last week in Nairobi Gabriel!

02 August 2025

Stefan Dercon on the MPI

From a presentation at the OPHI (the creators of the index).

What is the Multidimensional Poverty Index for? A beauty contest?

image

HT: Abhijeet

30 July 2025

Count the passes

Watch this video and see how many passes you count.

Did you see the gorilla?

The point of the video, put together Daniel Simons and Christopher Chabris is not the number of passes, but that something like half of people who watch this are so focused on counting that they completely miss the gorilla.

Stefan Dercon showed my class this during a lecture on poverty measurement at Oxford. What on earth does any of this have to do with poverty measurement? Stefan didn’t really explain, but my take was that, sometimes, perhaps, if we focus too much on measuring poverty we might not be paying enough attention to something really important, like, development or industrialisation.

All of this is a pretty long-winded way of introducing some of the recent discussions about the new UN Multidimensional Poverty Index developed at Oxford.

Duncan Green (Director of Research at Oxfam) thinks that “It’s a step forward on the previous Human Development Index, but only a limited one.

Martin Ravallion (Director of Research at the World Bank), notes that as with the HDI, “The index is essentially adding up apples and oranges … and no consensus exists on how the multiple dimensions should be weighted to form the composite index.”

Sabina Alkire (Co-creator of the new Index) responds to Martin by citing Sen: “There is indeed great merit… in having public discussions on the kind of weights that may be used.

Finally, Matt Collin (AidThoughts), notes that “Given that we need to unpack these indices to figure out what’s going on, why do we bother to pack them in the first place?

On balance, I think this is probably a useful data collection/sorting exercise, but would agree with Matt about the limited value of the aggregate index.

Especially given my currently developing obsession. Measuring the impact of an action upon a composite index is not going to be of pretty limited interest.

21 June 2025

Kenya fact of the day

11% of Kenya's GDP is transferred annually over cell phones (HT: Watson).

Or is it?

Since its inception [2007], the cumulative value of the money transferred via M-Pesa was over US$3.7 billion -- almost 10 percent of Kenya’s annual GDP (Safaricom, 2009). Aker and Mbiti

So somewhere between 4% and 11% then. Still not to be sniffed at.

Southern Sudan stat of the day

A few months ago the Ministry of Legal Affairs began a business registration exercise. Over 9,000 businesses were registered, of which 65% were in construction.